Introducing ‘turnover prediction & analysis’ to boost talent retention

Retaining your talent is fundamental to building a thriving business.
Replacing talent is disruptive for everyone in the team and expensive: it will cost your business, on average, $25,000 to $100,000* per employee.
The key element to avoiding turning is spotting red flags at the right time. But companies struggle with the timing to take measures to prevent employee turnover.
And that’s why we wanted to equip people leaders and managers with information they can use to make a tangible impact on retention.
We’re now launching a turnover prediction and analysis feature to support people teams in building thriving workplaces — the kind of organizations where people can (and want to) stay and grow.
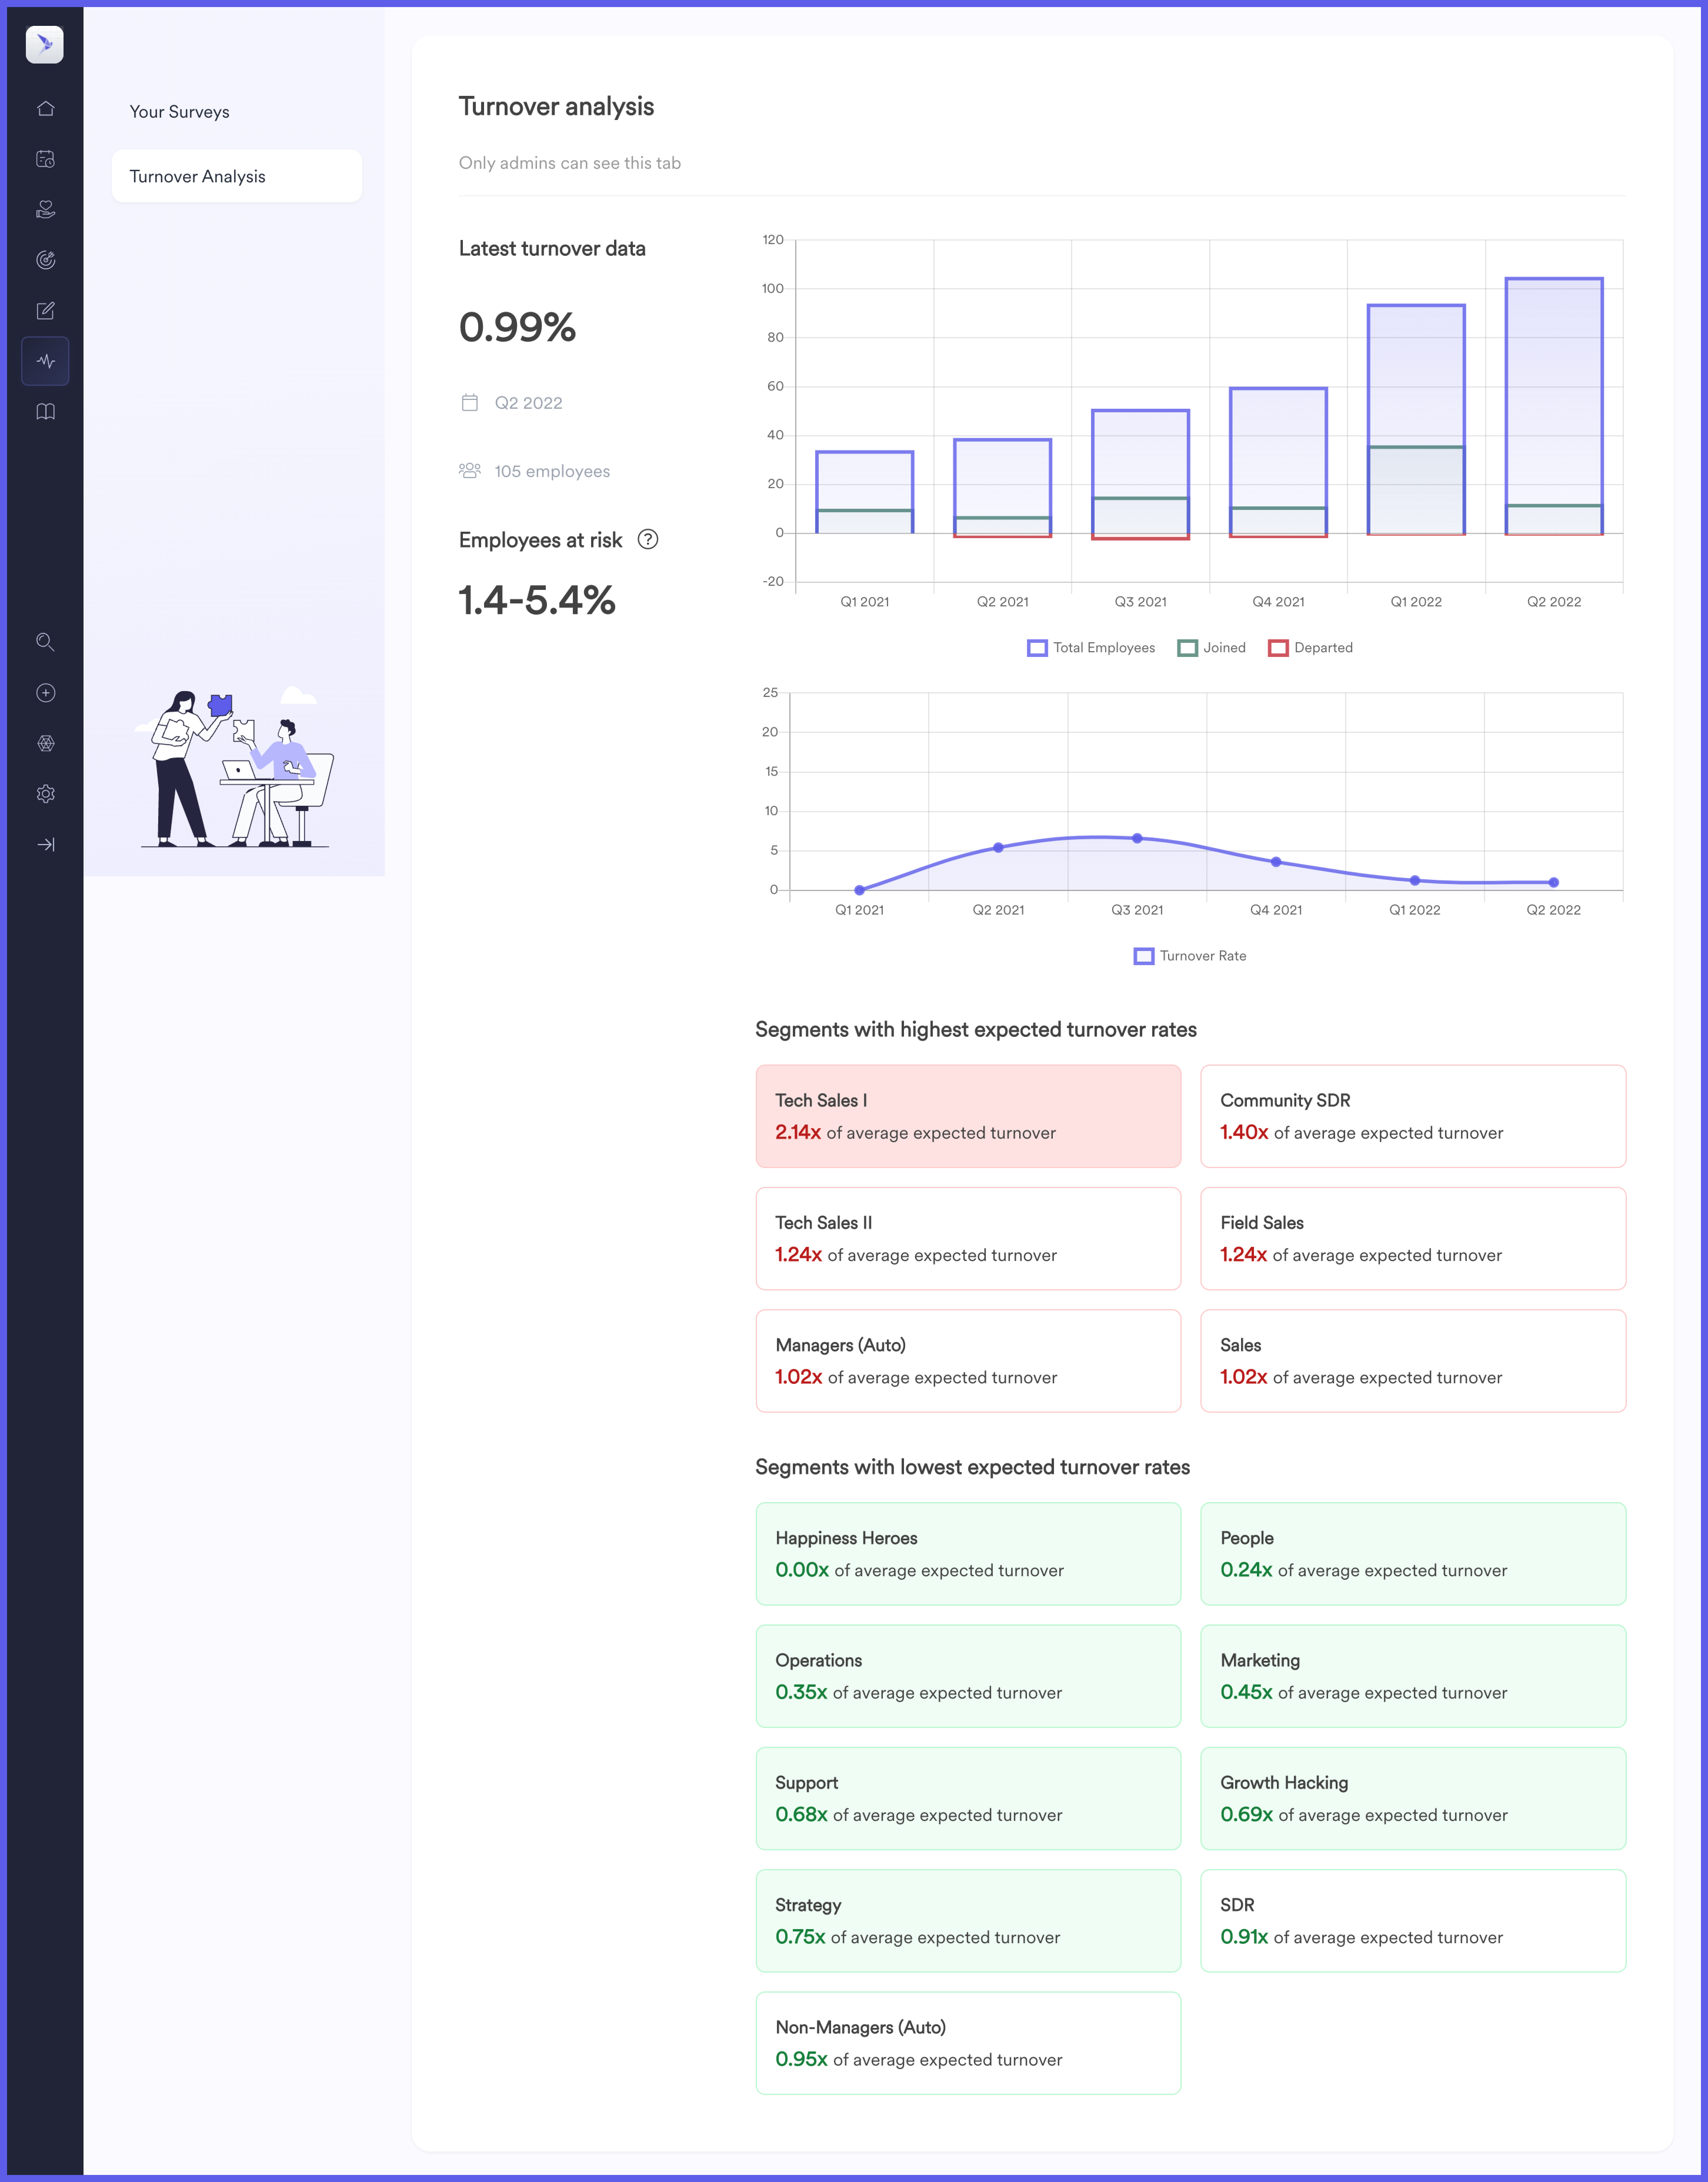
Here’s what Leapsome’s new feature to help you boost employee retention looks like:
*Gallup, 2021
Get an overview of current & previous employee turnover data
Find out your organization’s actual employee turnover over time and see how your company is growing.
From the graph below, you can easily spot trends for total employees (blue), people who joined the organization (green), and those who left it (red).
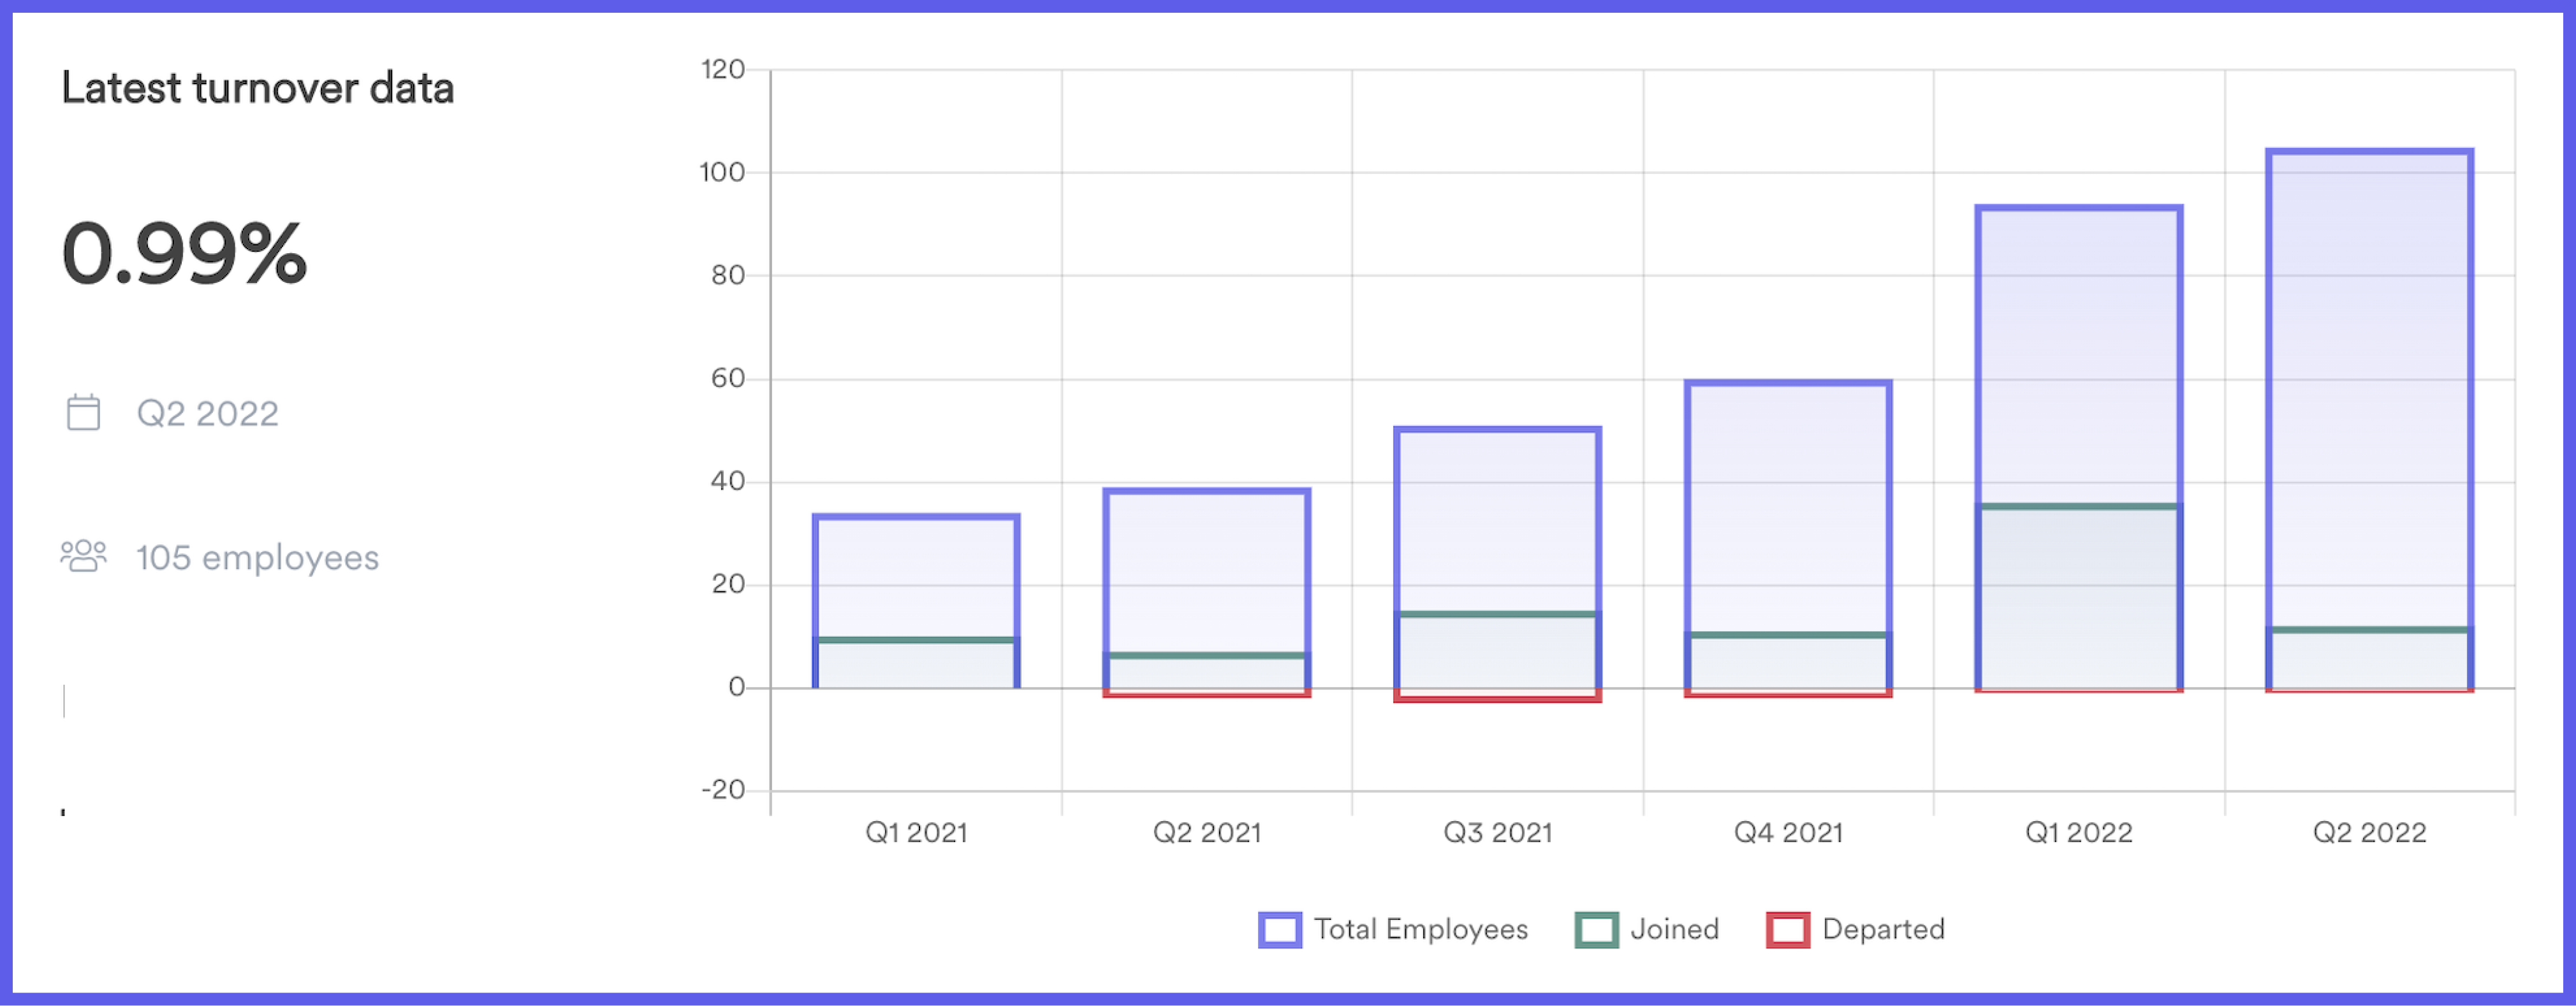
Access the latest turnover data and spot trends in how your turnover rate is changing to take informed actions to retain your people.
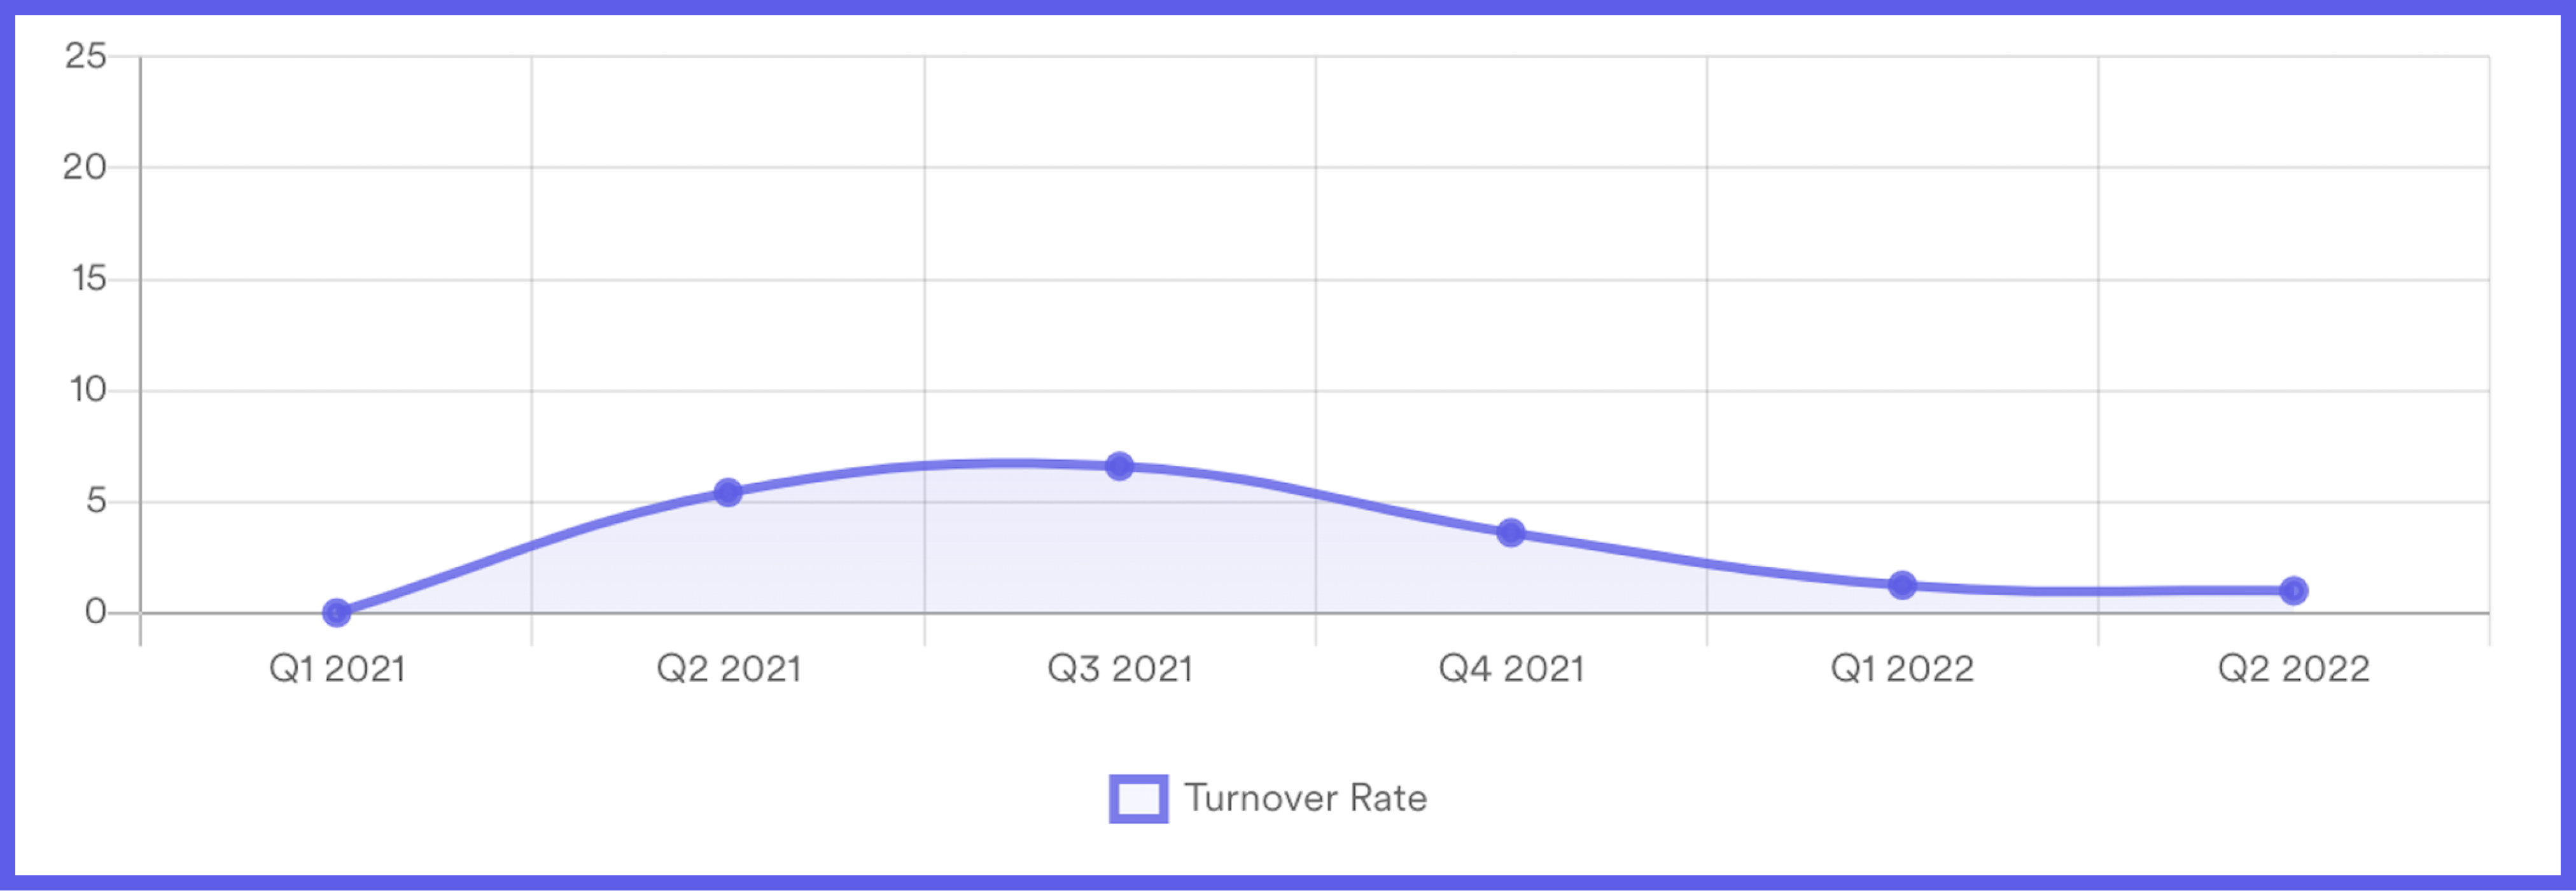
Our platform calculates turnover data by dividing the number of employees who departed by the total number of employees at the end of that quarter.
The example graph below shows a turnover rate that peaked in Q3 2021 and has kept decreasing.
Use the predictive analysis to address problem areas
The turnover prediction rate estimates employees that might leave the company in the future.
The turnover rates are categorized based on teams, enabling you to address issues within the teams with the highest expected turnover.
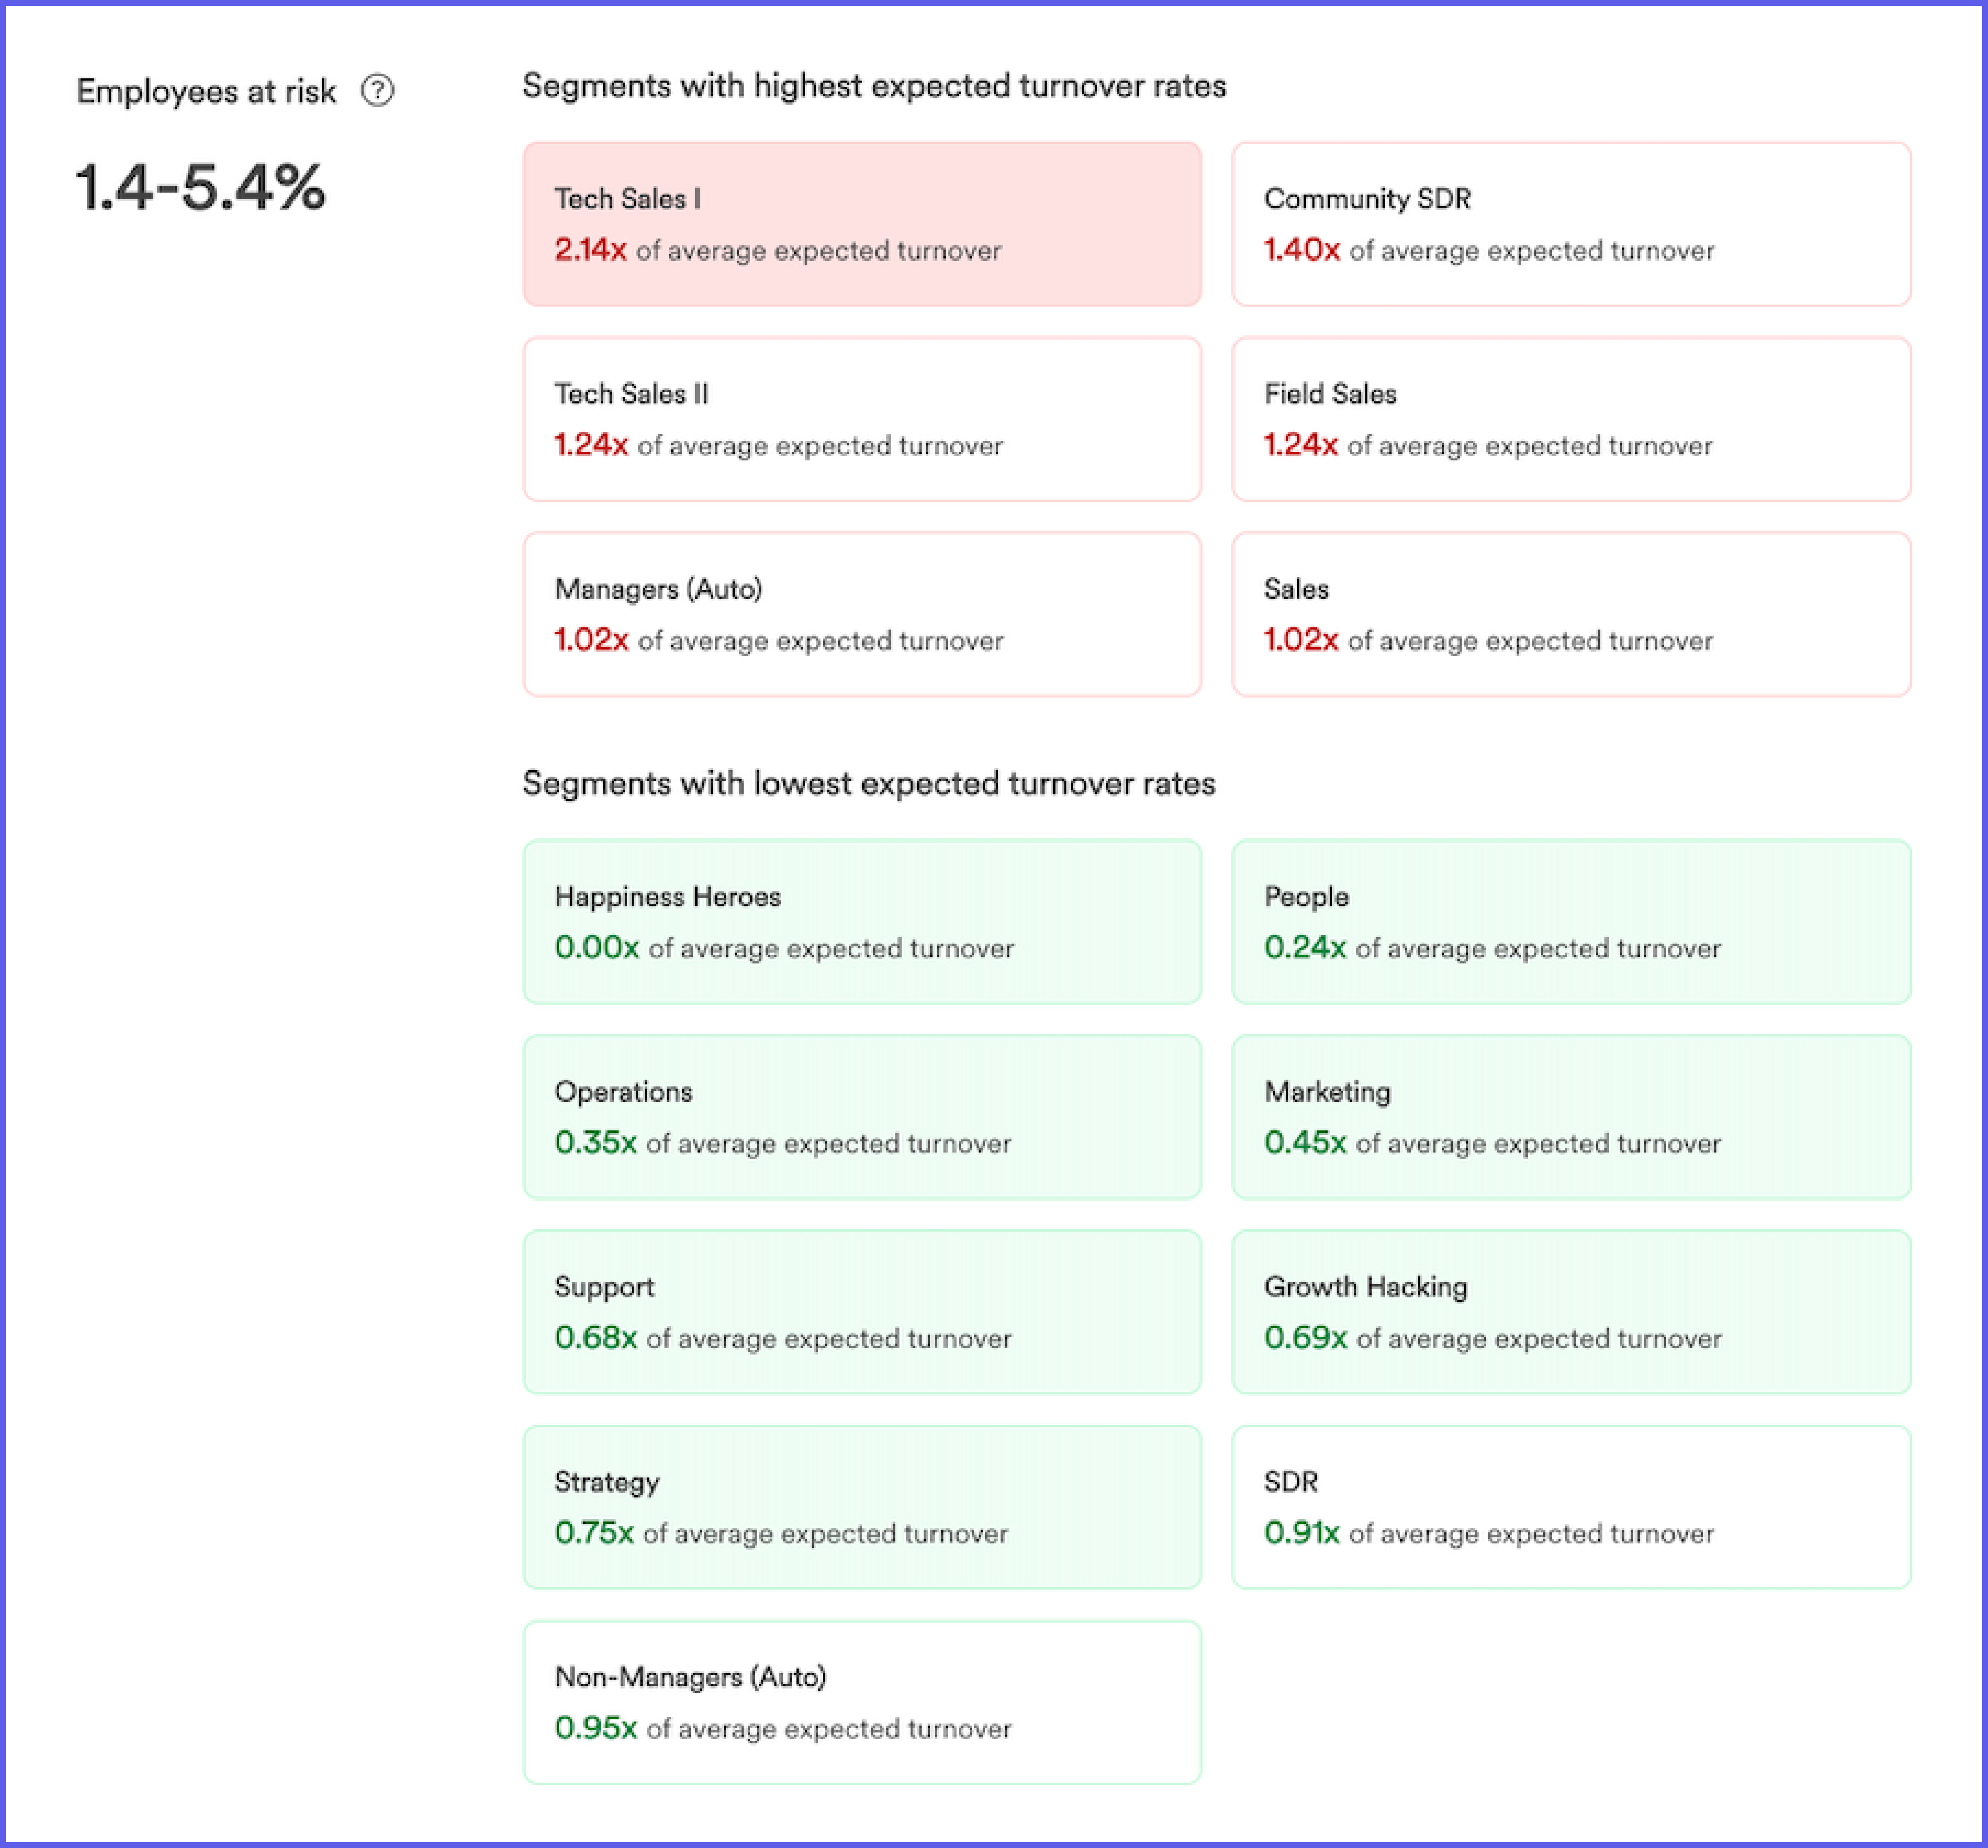
In the top section above, you’ll find the teams with the highest expected turnover rates. The section below shows the teams with the lowest expected turnover rates.
For example, you can see that the Tech Sales team has the highest expected turnover rate, followed by the Community SDR team.
The prediction rate is calculated in real time by an algorithm that considers multiple engagement data trends at your company. The prediction data range (1.4–5.4% in this example) keeps decreasing as the algorithm gets stronger with more data.
Understand turnover & take preventive steps to retain your top talent
Use the turnover prediction and analysis to spot trends in employee growth and identify problem areas. Take the right preventive steps at the right time to retain your top talent and build a thriving workplace.
🚀 Leapsome helps you understand your employees and boost engagement
Our easy-to-build engagement surveys provide powerful insights to improve the employee experience
👉 Book a demo and speak with one of our experts
Verwandte Artikel
Zurück zum BlogSind Sie bereit, Ihre Strategie zur Mitarbeiterförderung zu verbessern?
Informieren Sie sich über unsere Leistungsbeurteilungen, Ziele und OKRs, Engagement-Umfragen, Onboarding und mehr.
.webp)
.webp)
 Fordern Sie noch heute eine Demo an





.png)

.png)


