How to transform data into successful initiatives with people analytics

There’s a discrepancy between how human resources professionals perceive the employee experience and the reality. According to our newest report, HR estimates that over half their workforce is completely engaged at work, when it is really less than a third.*
While this perception gap exists, HR teams may not have the deep insights they need to develop effective people enablement strategies.
That’s why many businesses are turning to people analytics to gather comprehensive data on their employees’ performance, development, and engagement. Using this strategy gives them an in-depth look into every area of their organization from multiple perspectives. That way, they can gain more meaningful insights, catch every opportunity for growth, and consistently improve on business outcomes.
Our article will explore the what, why, and how of people analytics to help you get started with a clear strategy. We’ll look at the key metrics you need to track, essential steps to take, and how Leapsome can support you.
*Leapsome Workforce Trends Report, 2023
What is people analytics & how does it work?
People analytics involves collecting and interpreting employee data to inform business decisions. Although it's mainly the domain of human resources and people operations, it’s ideal to collaborate with all departments to gather well-rounded insights from every corner of your company.
The aim of people analytics is to uncover trends that indicate your organization’s strengths and weaknesses. Using this intel, you can find ideas to develop employees, improve business outcomes, and make your company a more enjoyable place to work.
For example, imagine your people team is analyzing hiring and retention data in response to understaffing complaints. The results indicate that your employee turnover rate is average, but your recruitment rate is below the industry standard. Now you know that you should focus on increasing recruitment efforts by marketing yourself to job seekers and fine-tuning the application process.
Increasing numbers of businesses are recognizing the impact that people analytics can have on their overall performance — HR teams are ten times more likely to deliver impactful insights to leadership when using these tools. However, two-fifths also say their company underutilizes people analytics when developing new initiatives.
🤖 Quick, relevant data with no risk of human error
Use Leapsome’s people analytics to measure, track, and filter workforce data and gain actionable insights.
👉 Learn more
Key people analytics best practices to keep in mind
The most impactful people analytics processes empower you to make informed decisions that have the power to impact your organization at every level. They also make the employee the focus at every stage.
Here are some best practices to ensure you’re using people analytics to its maximum potential:
- Get leadership buy-in — People analytics might mainly be HR’s responsibility, but it impacts the entire organization. That’s why business leaders need to understand its potential and invest in the tools and resources to support it.
- Involve all stakeholders — To get a comprehensive range of expertise and perspectives on your data, involve everyone from HR to people ops to department heads to employee representatives. They can provide some key insights that you may not have considered.
- Be fair, transparent, and consistent — Teams may be apprehensive about reviews and surveys. Explaining the why behind them and what you’ll do with the data will establish more trust. You need to treat every employee equally to maintain that relationship, as team members will be more enthusiastic if they don’t feel singled out or excluded from the process.
- Protect your data — Security is both a moral and a legal concern, as some information leaks could violate the General Data Protection Regulation (GDPR) and other privacy legislation. If sensitive data gets out, you could lose the trust of employees and even incur a fine. To keep responses private and maintain psychological safety, consider making all surveys and questionnaires anonymous.
- Stay ahead of key people analytics trends — Data scientists and HR experts are constantly making breakthroughs. To ensure you have the most advanced analytics capabilities, attend HR conferences and follow top people ops influencers. They’ll discuss the latest research and show you which tools, methods, and metrics are best to use.
The key HR metrics you should be familiar with
The success of your strategy depends on understanding what good people analytics looks like. You need to know which metrics to measure and how you should interpret them.
Although your approach to people analytics should depend on your context, there are some universal indicators of business health to consider. Here’s a breakdown of these metrics and what they can tell you:
- Individual performance — This metric demonstrates each employee’s proficiency in their role. Scores can indicate how well leaders and managers are setting up teams for success and helping them grow.
- Team performance — You can also appraise groups and departments on their ability to collaborate and communicate. Lower scores may suggest that team processes are inefficient or there’s a lack of connection or camaraderie.
- Productivity — The type of output you might measure for this category will vary according to your size, industry, and department. Some examples include clients landed, sales targets reached, and projects finished by a specific deadline. Poor performance could mean anything from inefficiencies in your processes to burnout, so it’s best to analyze productivity alongside other metrics.
- Progress toward goals — This measures the degree to which employees and teams meet their objectives. If they consistently fall short, you may need to provide further clarity or extra support or make your aims less ambitious.
- Employee engagement metrics — One way to quantify your team’s feelings and attitudes toward their work is with engagement surveys. Responses to specific questions can be great indicators of where problems lie. For example, an average score of three to the statement ‘rate how aligned with company values you feel out of 10’ likely indicates serious issues with your company culture.
- Employee net promoter score (eNPS) — This kind of HR data reveals how many of your people would recommend your workplace to others. High scores mean they tend to see your business as a great place to work.
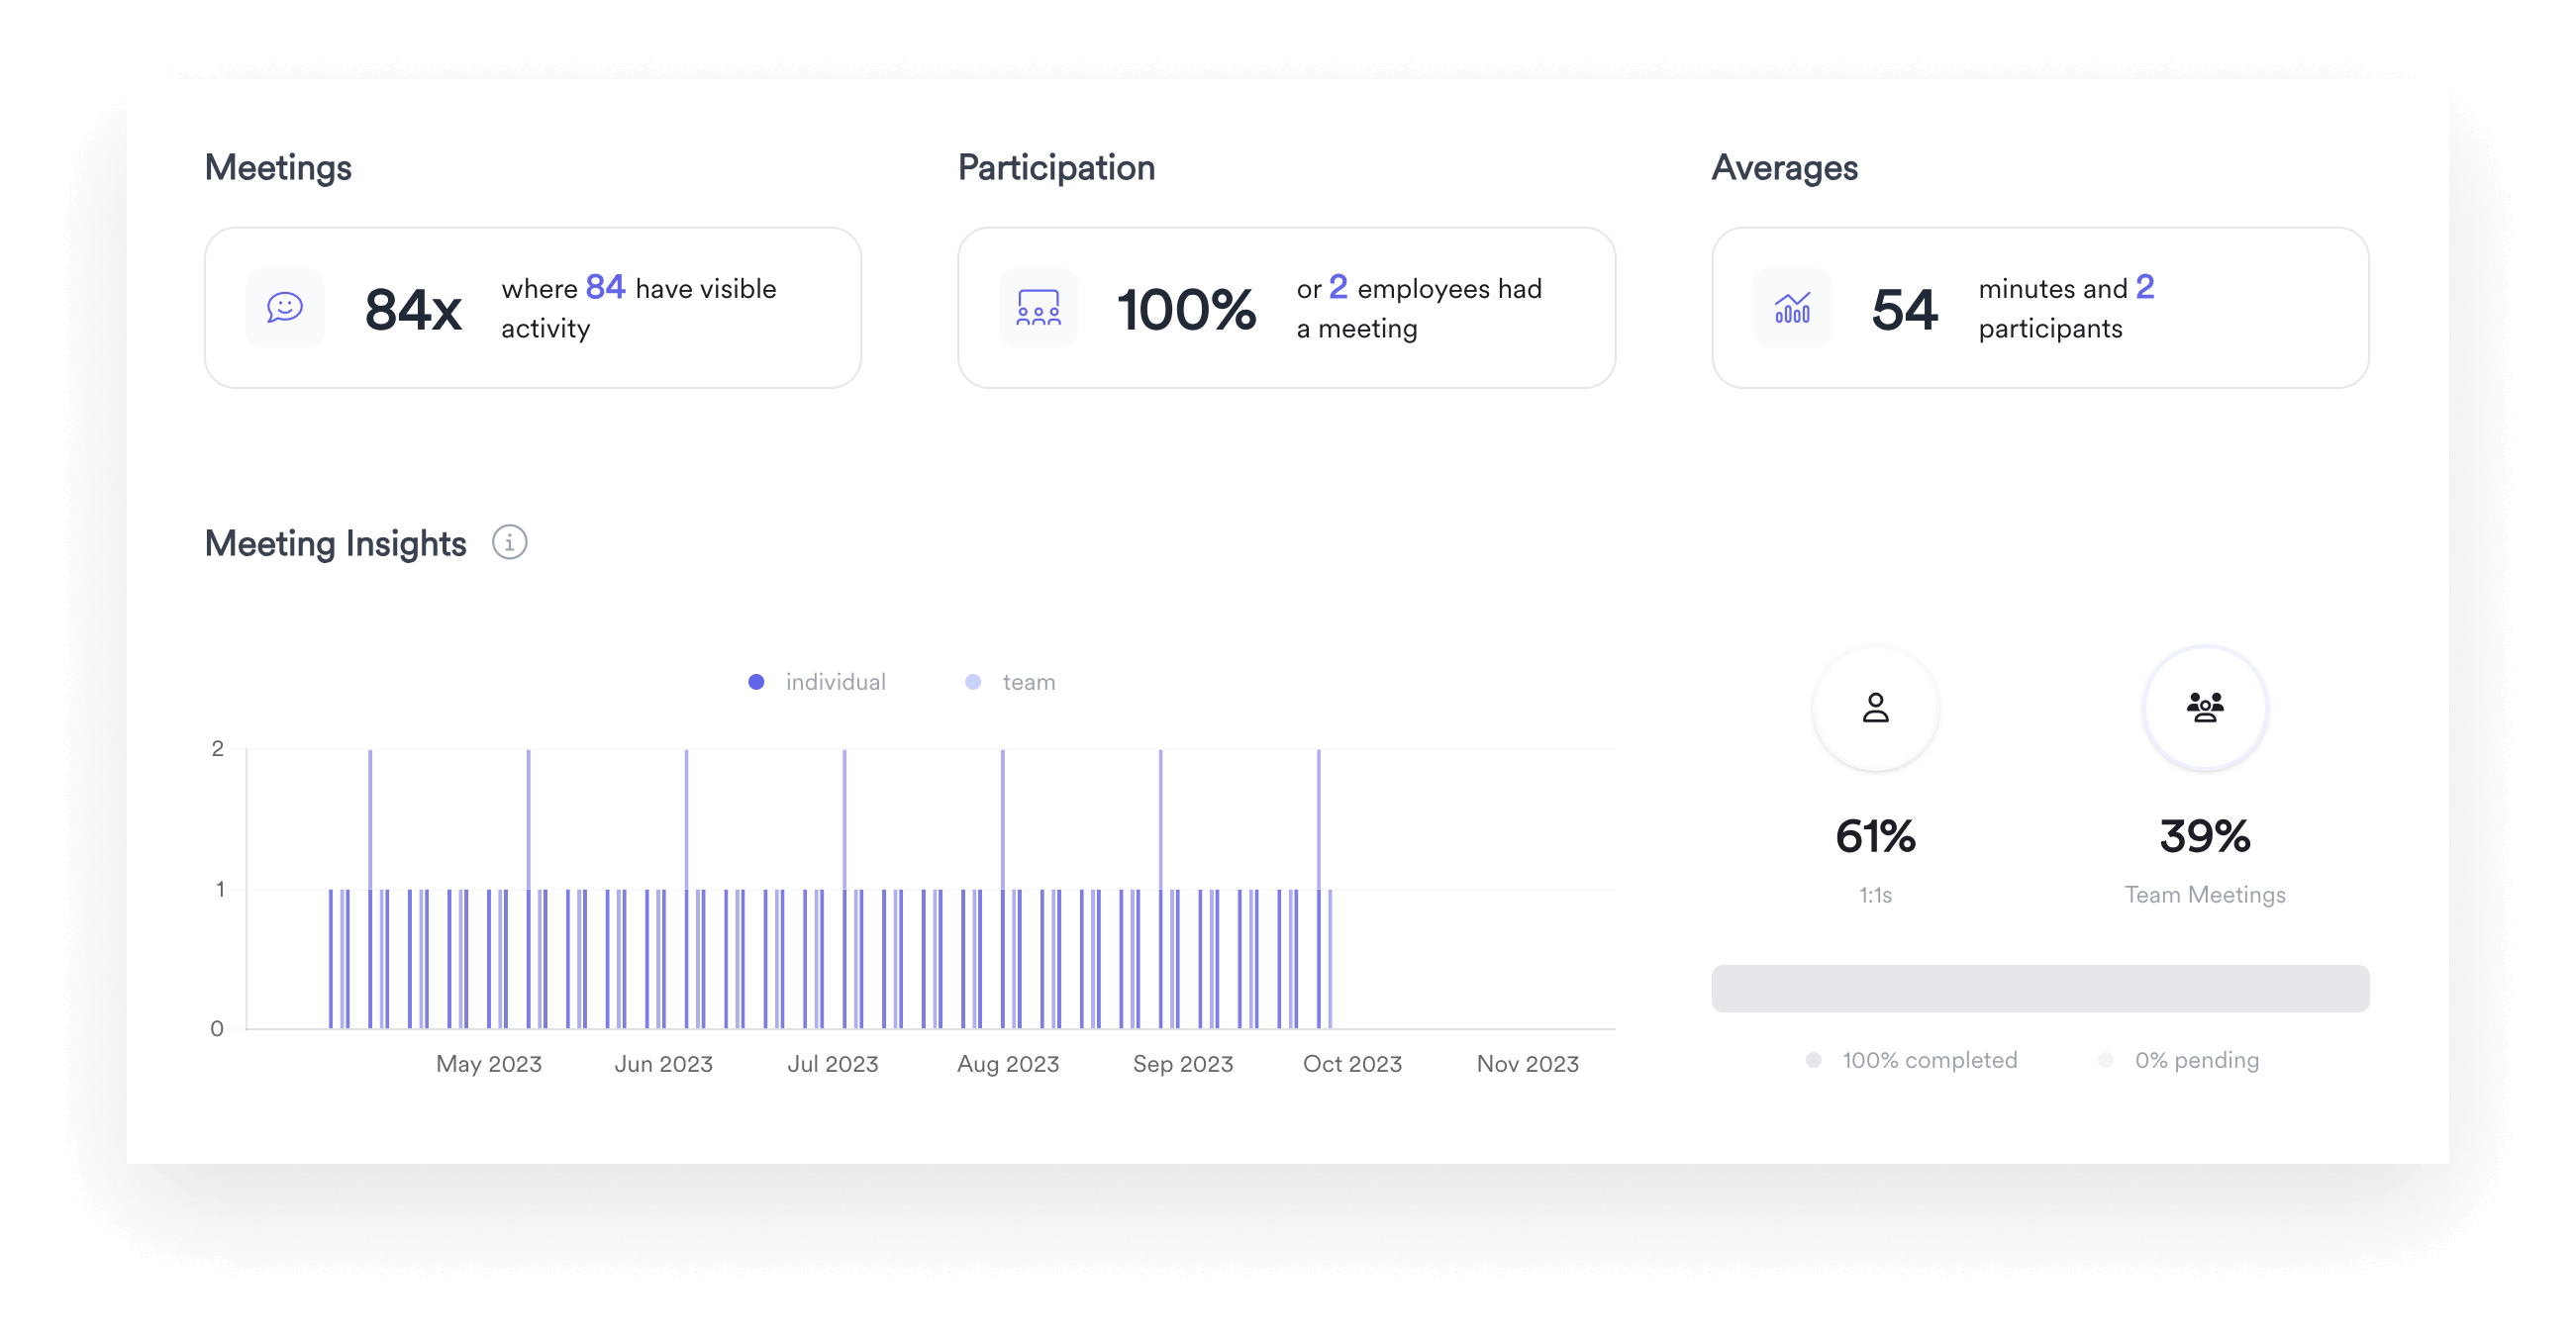
- Attendance — Issues with burnout and low morale can lead to employees taking more time off. That’s why you should check the percentage of scheduled days each team member works to look for patterns. You can also check meeting participation rates to see whether the numbers support your results.
- Turnover — The rate at which staff leave your company can reflect their loyalty and job satisfaction levels. You can benchmark your turnover against the industry average on the Bureau of Labor Statistics (BLS) website to see how well you’re retaining employees.
- Tenure — Measuring how long team members stay with your organization can show you how well you’re likely to retain new hires and maintain job satisfaction levels in the long term. High quit rates in the first year may be a sign that your onboarding program isn’t effective. On the other hand, if team members tend to resign after two years, that might indicate that you’re not investing enough in their growth and development.
For the most accurate results, consider metrics as a whole and not in isolation. For example, an increase in the number of emails could indicate extra productivity. However, you have to check you’re also hitting your targets to confirm this data is due to improved performance and not inefficient communication.
💪 Empowering employees starts with learning all about them
Leapsome’s people analytics tool collects and analyzes the most important data from across your company in real-time.
👉 Learn more
Different types of data analysis in HR
Once you’ve collected employee data, you can use people analytics in one of three ways. They all serve different purposes, so it’s ideal to mix and match depending on your needs:
- Predictive analytics — Use historical employee data to forecast future trends and outcomes. Predictive people analytics are especially useful for gauging whether conditions will be favorable for future plans. For example, if you’re expanding several departments and predict high turnover during your fourth quarter, you know to invest more in recruitment and retention.
- Descriptive analytics — Examine past employee data to find trends and patterns. These insights may explain past failures, challenges, and downturns so you know better how to avoid them in the future. You might see that you missed a target just after a merger, which suggests the upheaval disrupted your operations.
- Prescriptive analytics — Consult your people analytics tool for recommended actions based on your data to address weaknesses, make improvements, and maintain areas of strength. That means you get immediate, practical insights that can guide your decision-making.
6 steps to set up people analytics within your company
Implementing people analytics is a complex initiative that goes beyond collecting the right information. There are tools and resources to consider, not to mention objectives and how your analysis fits into the bigger picture. That’s why it’s essential to have a detailed strategy in place before you start.
1. Identify areas for improvement
Consider the specific challenges you want to address and how people analytics could help you solve them. You can think about the issues you’ve observed or the opportunities you’d like to capitalize on first.
People analytics is widely applicable, but some common reasons for collecting data are hiring and retention strategies or improving performance. You can also ask other departments for insights into possible areas for improvement.
Ensure your people analytics ties into your company’s long-term goals as all plans should contribute toward your ongoing growth. Taking this step also encourages buy-in from leadership as they’ll be able to see the potential impact of any initiatives you develop. For example, you can show the CEO how engagement levels will double and thereby increase productivity and profitability while improving morale.
2. Gather tools & resources
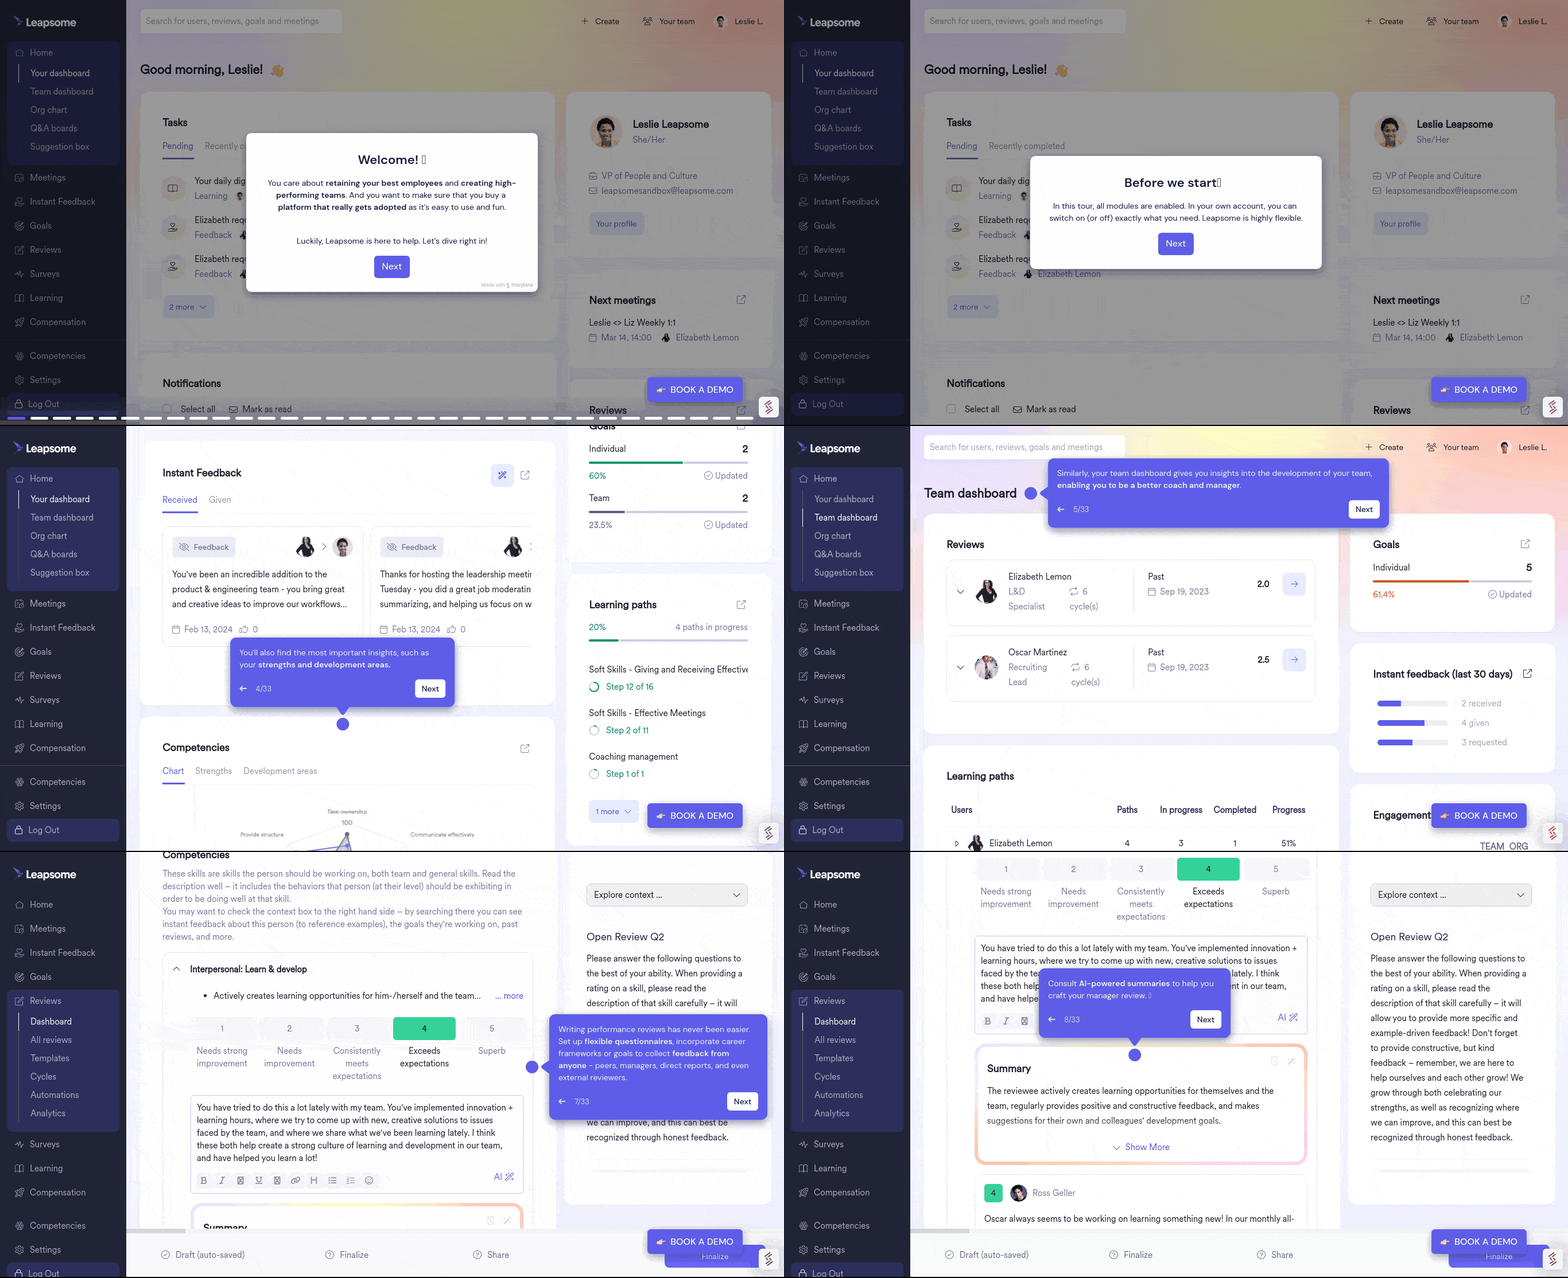
Nothing’s more important to the success of people analytics than the tool you use. Choose a platform that’s intuitive, customizable, and allows you to integrate with popular human resources information systems (HRIS) to expand your data set. Leapsome, for example, has the following features:
- Manager’s dashboard — Give leaders a closer look at their team’s performance so they can take relevant, immediate action. They can react quickly to dips in engagement, productivity, or attendance before the problem escalates.
- Compatibility with a range of metrics — Supports many different data types, from engagement and retention to performance and development. The more kinds of information you can measure, the more areas of your company you can understand and improve.
- Data visualization — Looking at a long list of numbers is difficult to process and can require a lot of manual analysis to turn into action. Ideal people analytics software should plot information on a variety of graphs and other forms of visual media so you can easily make sense of the results and understand what to do with them.
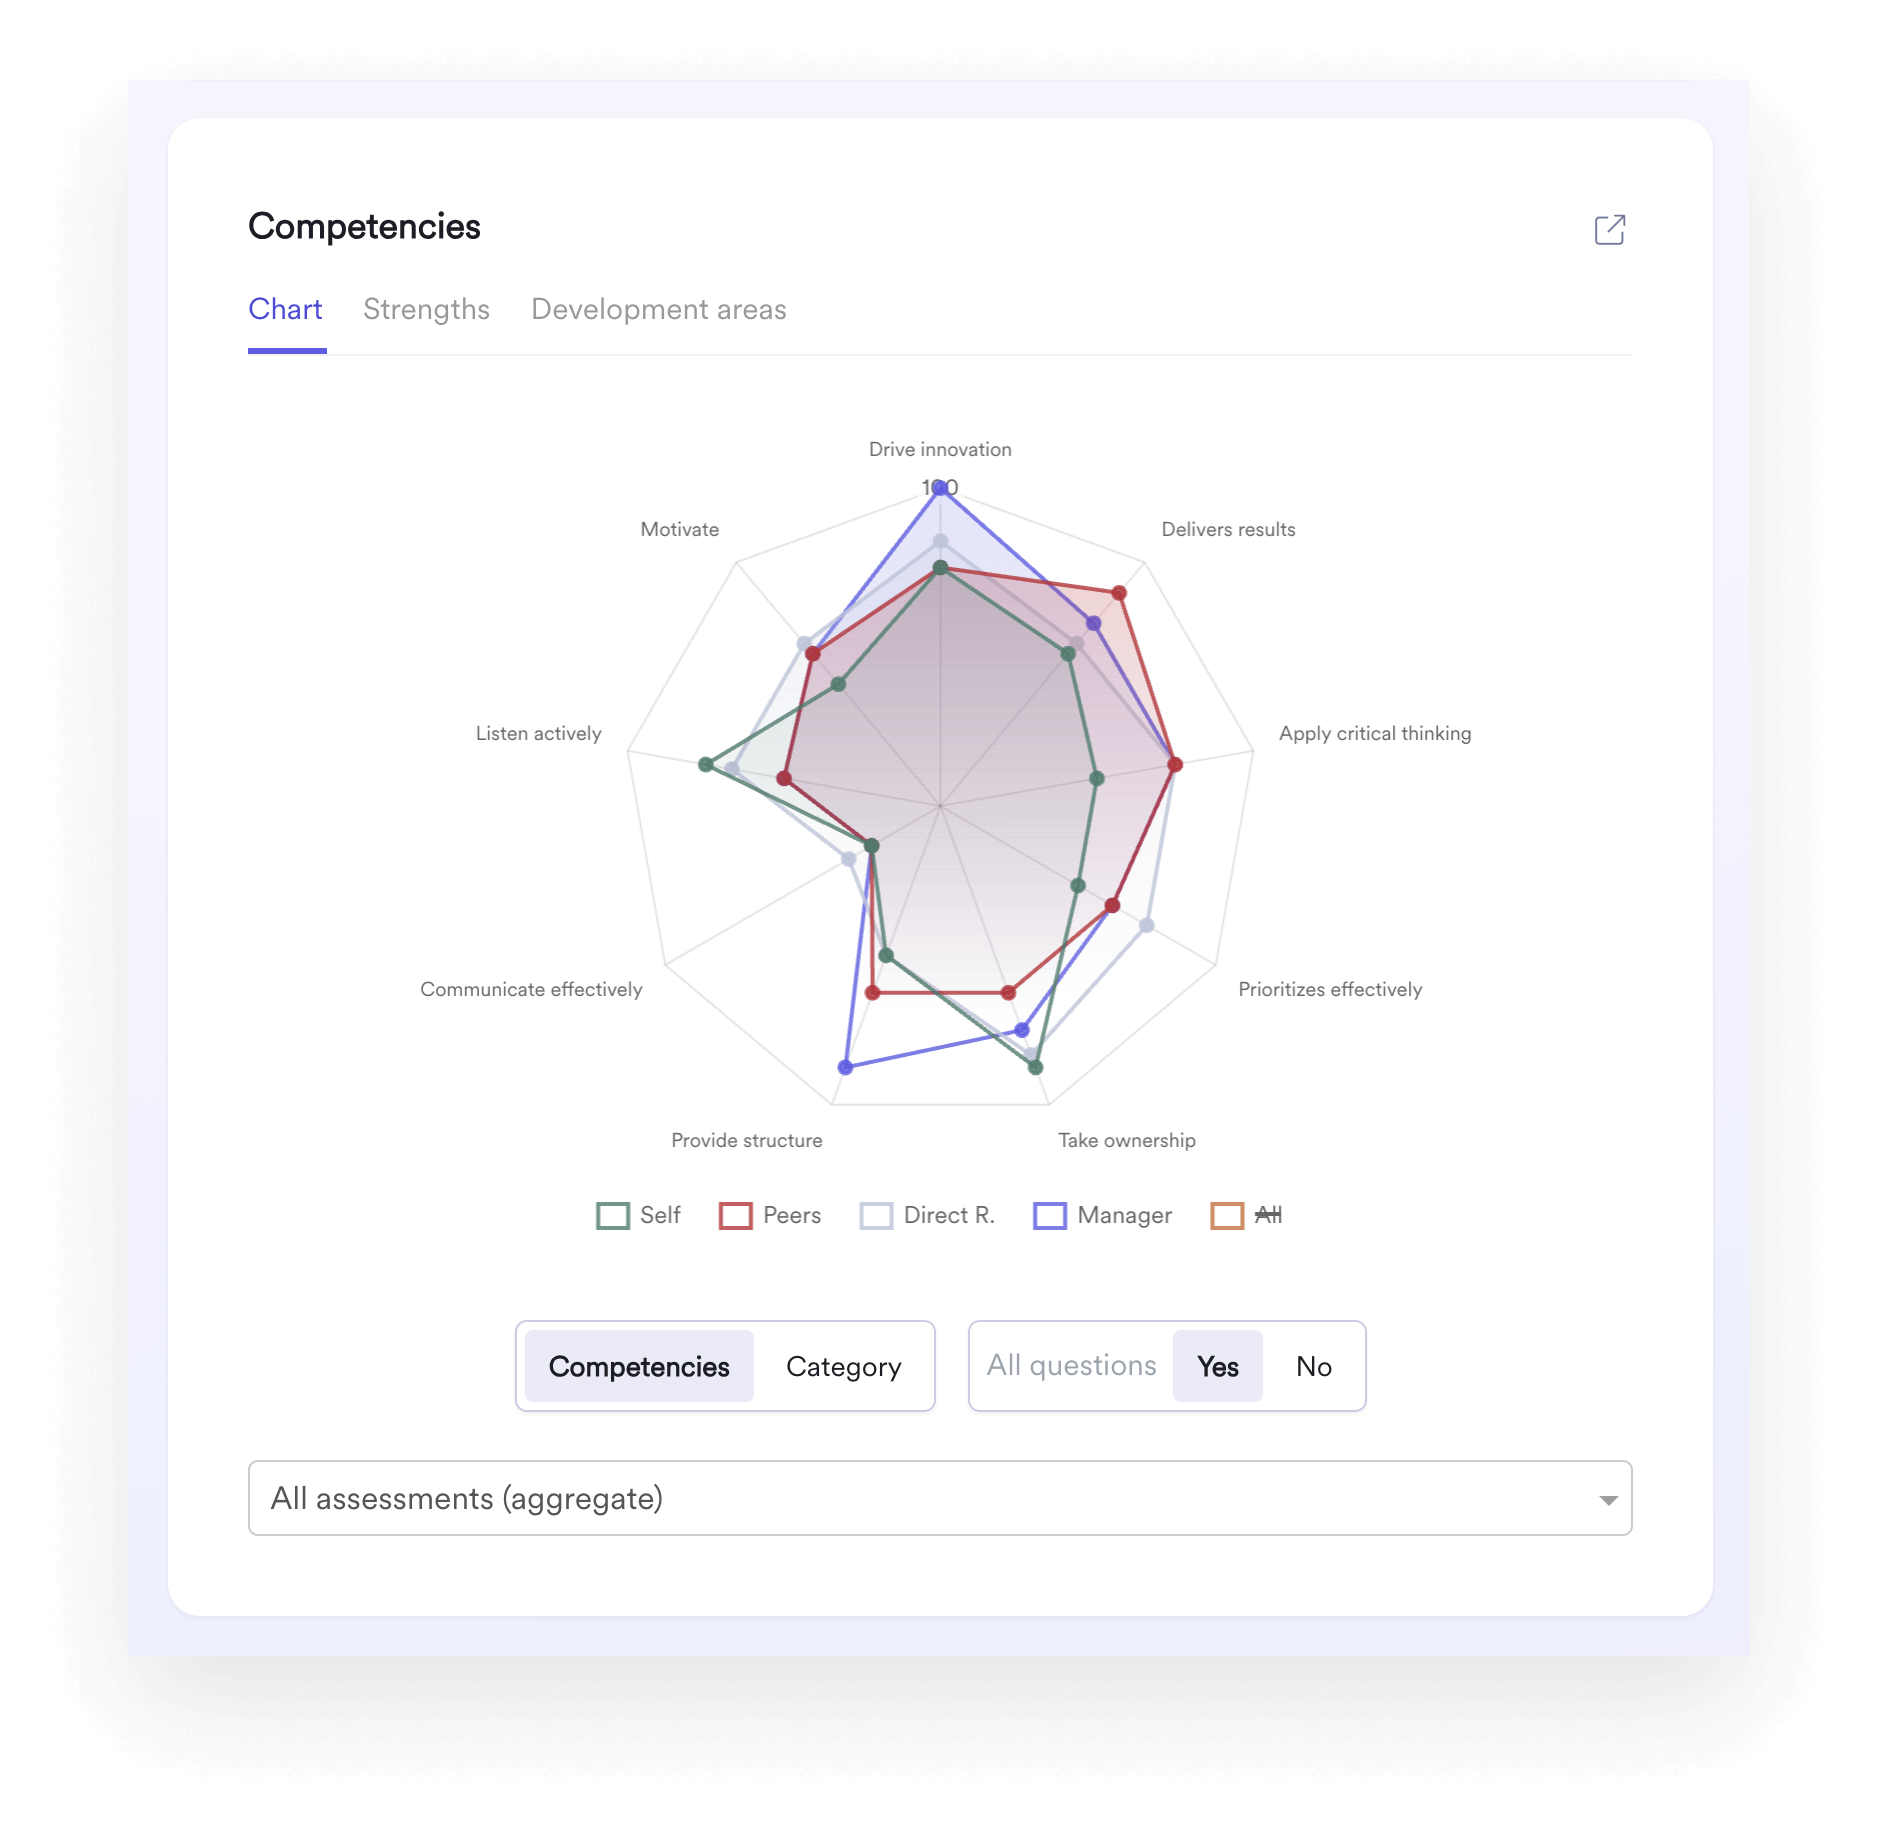
- Advanced segmentation and custom attributes — Choosing parameters like department, tenure, and role enables you to spot patterns more easily. For instance, a quick look at overall performance may display good scores. However, when you search by tenure, you may see that new hires aren’t meeting expected results, indicating an issue with onboarding.
- Actionable insights — The best tools not only collect data but also identify trends, correlations, and possible areas of growth. This can eliminate human error and oversight while you’re analyzing results.
Depending on the metrics you want to measure, you may also require other software tools. For example, if you’re handling sensitive employee information, you might need data and security protection. There are many people analytics tools available. Similarly, if you’re assessing sentiment, you’ll need a survey tool like Leapsome that has anonymity options.
3. Collect your data
Start by gathering the information that’s most relevant to your objectives. For instance, if you’re assessing retention, calculate your turnover rate for the last quarter.
You’ll also need a comparison point, so you might collect historical retention rates and industry data as well. Then, you can make conclusions about whether you’re on an upward or downward trend and benchmark yourself against previous performance.
You may need to perform a long-term analysis, as defining a time limit and setting a frequency will help keep your findings accurate, consistent, and organized. Say you check retention levels in the first quarter — you’d compare your findings against the other quarters, not previous months or years.
4. Interpret your findings
Visualizing raw data helps you consider the information you have at hand from different perspectives. The types of visuals to use depends on what you’d like to measure. Here’s an overview of the most common and popular ways to visualize data:
- Bar graphs — As you can indicate more than one parameter on the x-axis, bar graphs are good for comparing subgroups. For instance, you might measure performance and see that the finance department normally experiences a surge in productivity the month after they complete tax returns. Upon further examination, you may find that this result is a reaction to a rewards program that the team lead started.
- Timeline graphs — As the name suggests, timeline graphs are best for evaluating progress over specific periods. You can filter by quarter, year, or decade to look at trends in more detail. For example, a dip in engagement the previous year might disguise a general upward trend in the last ten years.
- Score bars — Multi-colored bars show what percentage of employees scored in specific categories. For example, these graphs might display ‘engaged,’ ‘neutral,’ and ‘actively disengaged’ team members. Score bars can be handy to help you visualize responses to multiple-answer surveys in particular.
- Radar charts — As these charts present multiple metrics that use the same scale, they’re excellent for displaying appraisal scores. You can quickly compare each individual’s strengths and areas of growth.
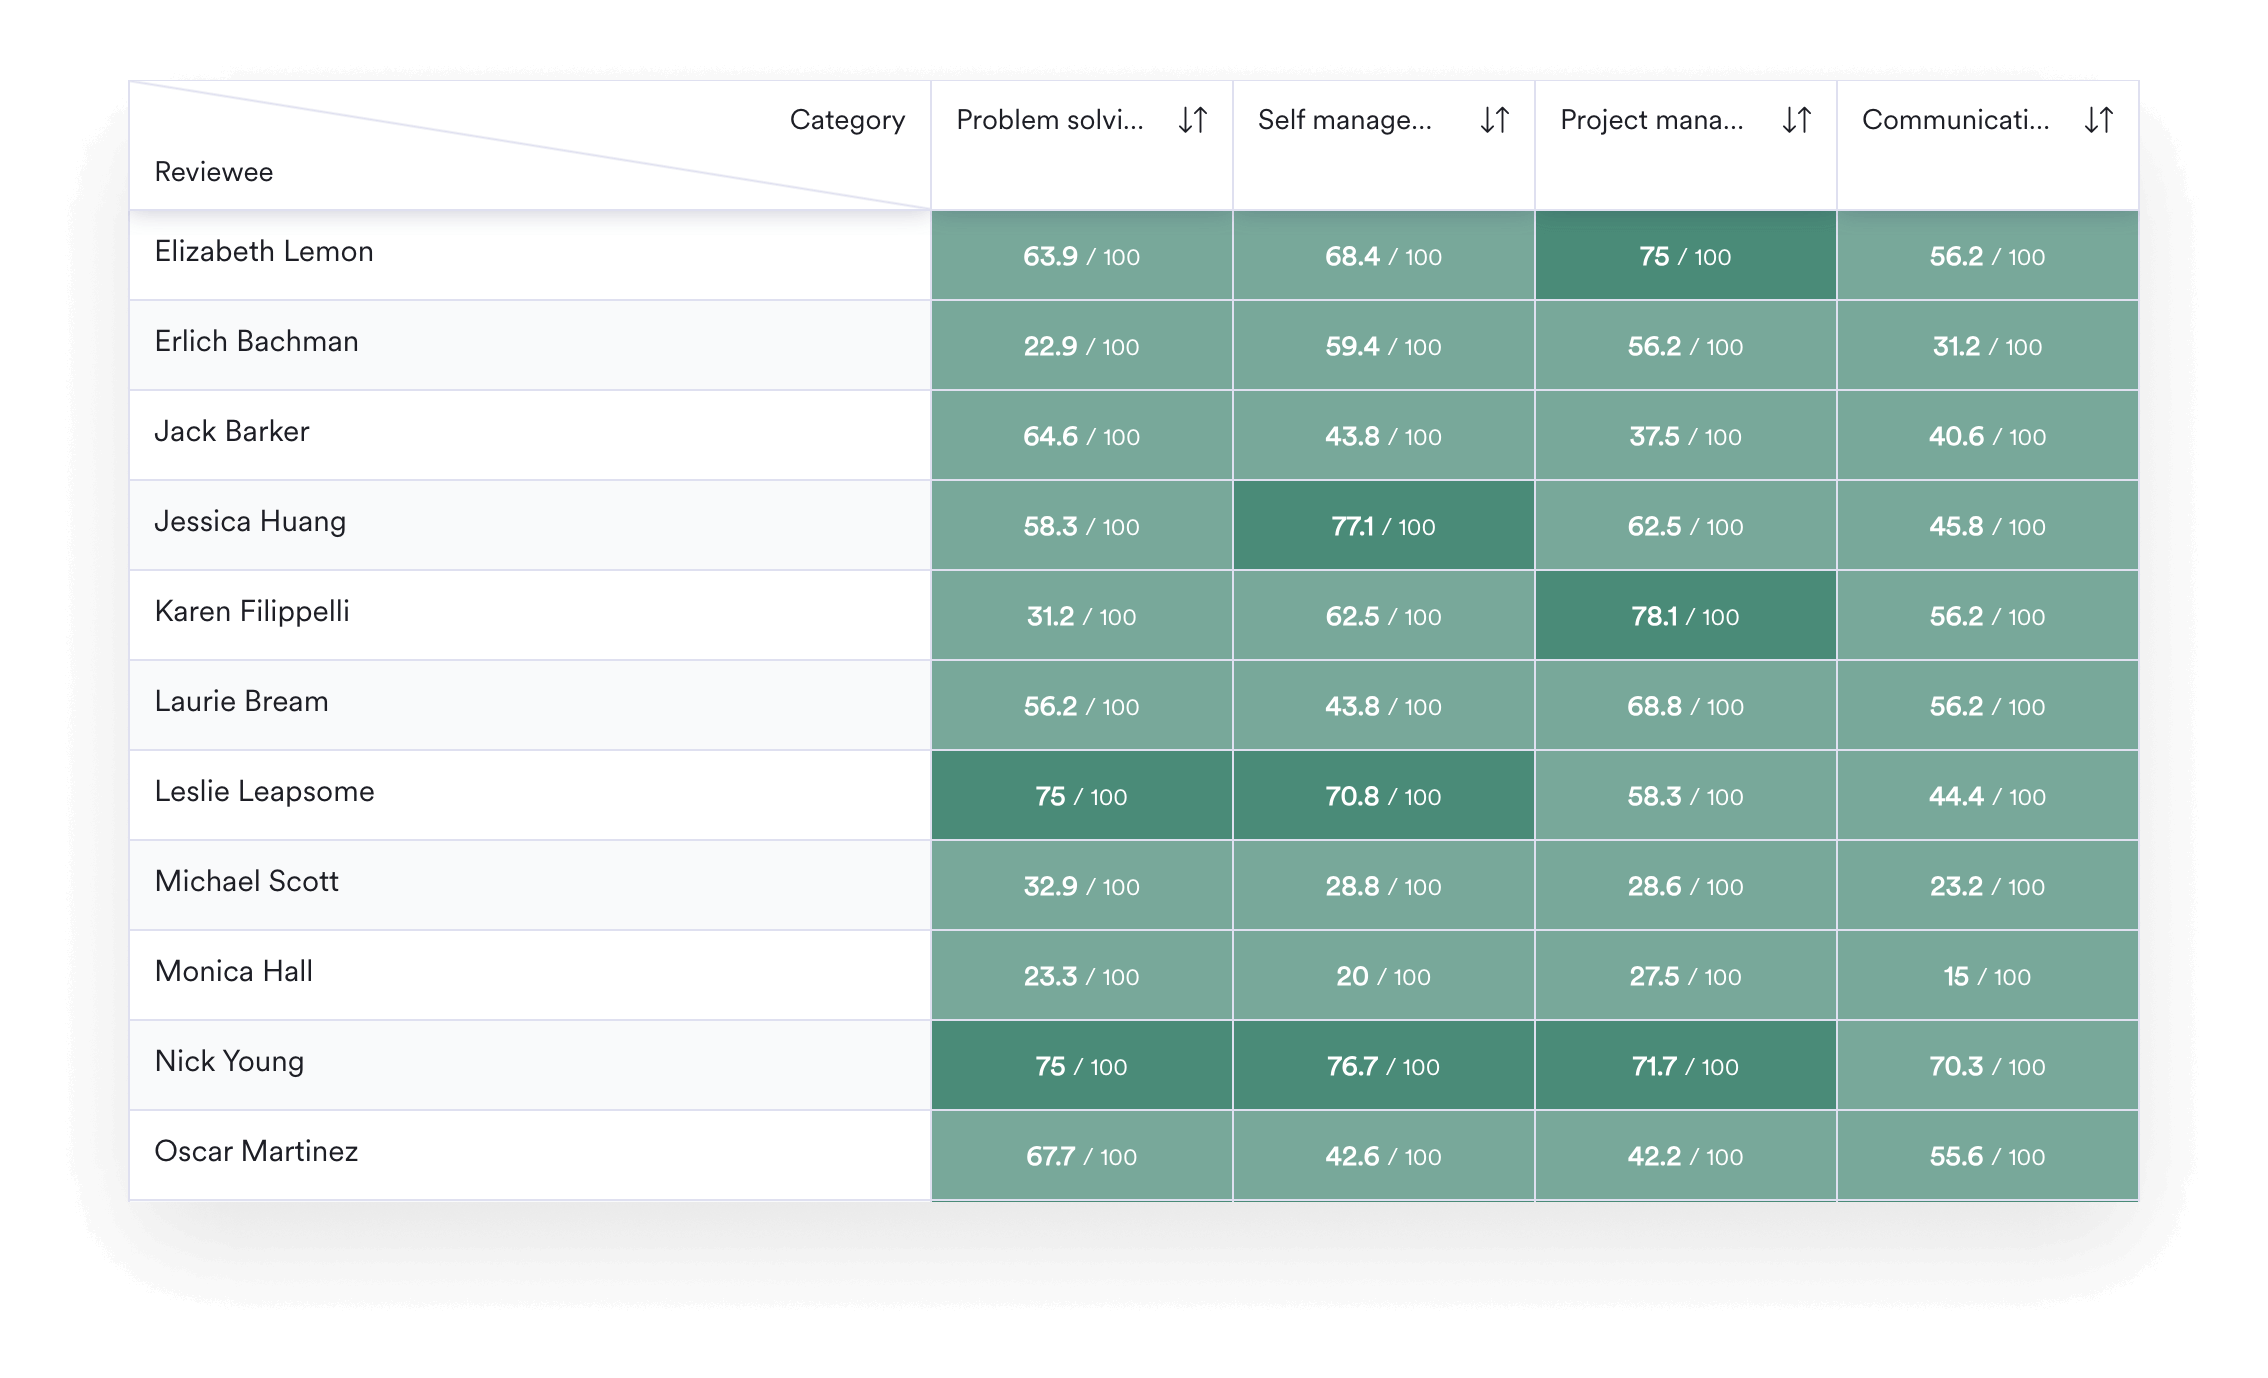
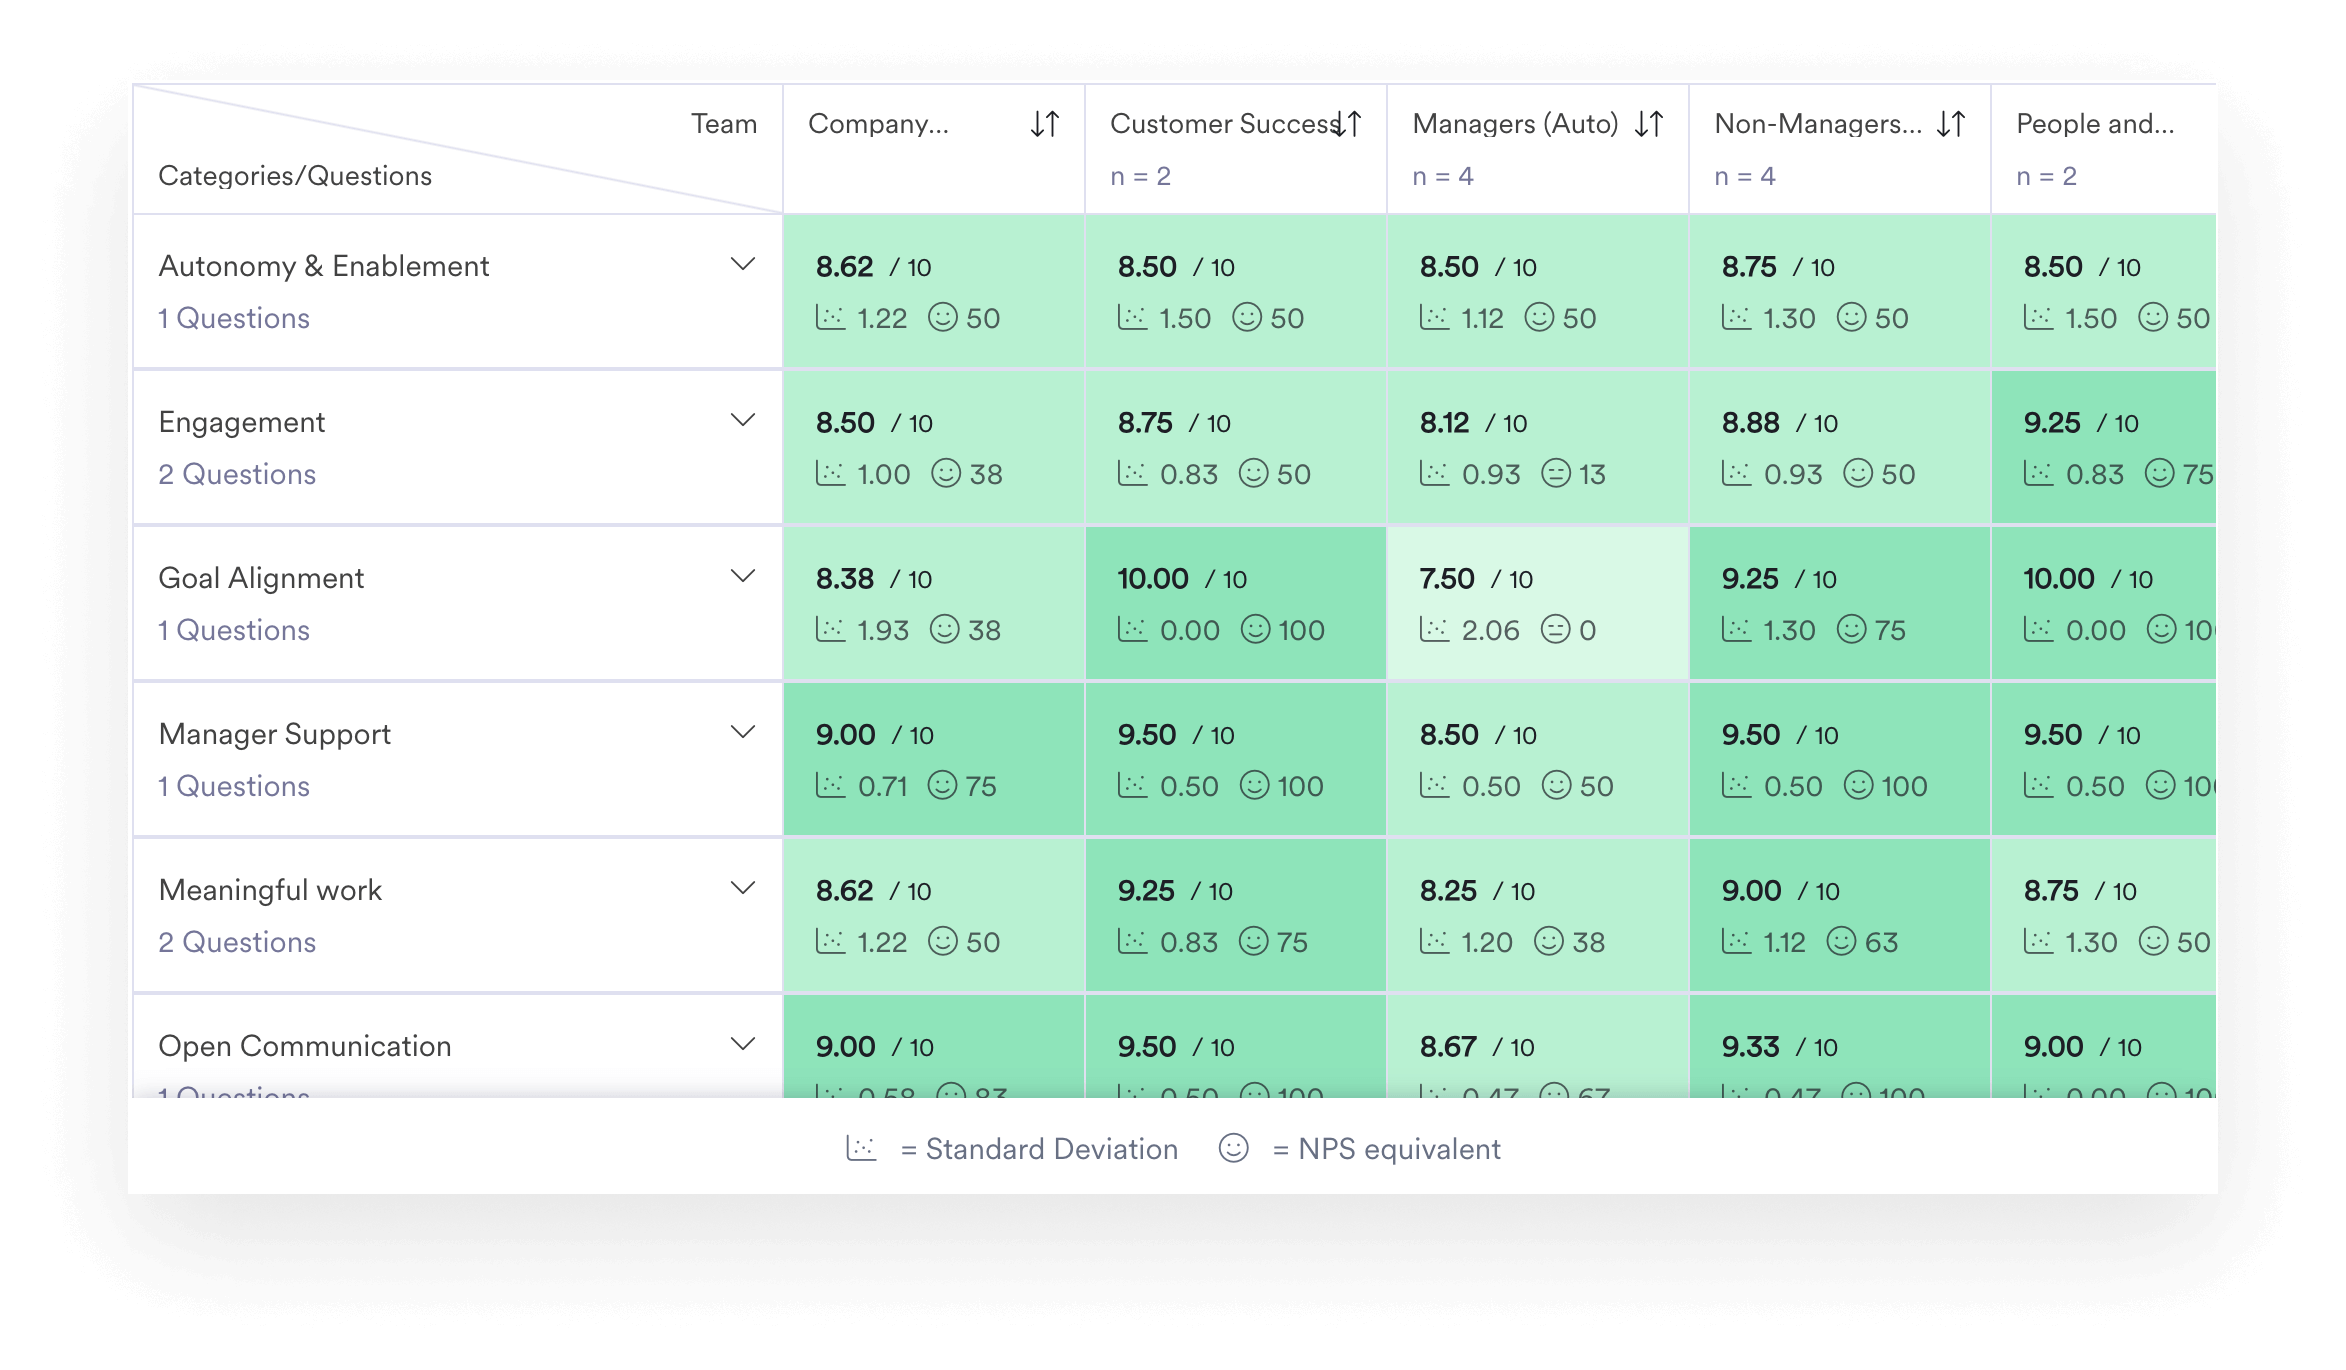
- Heatmaps — These enable you to present multiple forms of data in color-coded tables to reveal areas of attention. For example, you could have survey results with the average score, the number of participants, and the percentage change since the last questionnaire.
Lastly, while it’s not necessarily a data analysis tool, having an overview of survey comments can inform the way you interpret information. You might see that an employee wasn’t sure that they understood a question or didn’t feel that any of the answers represented their opinion accurately.
5. Devise strategies & measure their impact
Once you’ve analyzed your data, put it to the test by using your findings to develop new initiatives. You can target areas for improvement and track key performance indicators (KPIs) to measure your strategy’s short and long-term successes.
Let’s say you’ve checked productivity, performance, and engagement levels to find the culprit for long project completion times. You may have discovered that teams are motivated and your processes are effective, but performance is lower than expected. Subsequent investigations reveal that employees lack vital skills, which keeps causing delays and bottlenecks.
Feedback suggests team members are motivated to learn but have insufficient time to attend the courses. On that basis, you decide to dedicate four hours every week to development.
To measure impact, you continue to measure performance and productivity levels but also track course attendance and completion rates. You immediately see an improvement across all areas, so you can confirm your people analytics process and subsequent strategy is working and is on the right track.
6. Review & adjust your approach
As businesses are in a constant state of change, it’s best to continuously check and improve your people analytics process.
It’s key to regularly research whether there are any updates or innovations in people analytics software like Leapsome to see what new features you can use. Platforms like ours are consistently adding features and adjusting tools to adapt ourselves to technological advancements and workplace changes. We announce all our updates on our Platform Improvements page, so it’s easy for customers to keep track.
Furthermore, investigate whether people analytics are helping you to hit objectives and make meaningful improvements to internal operations. If you notice that your strategies are becoming less effective, you may need to adjust how you collect, interpret, or act on your data.
For instance, you might observe that overall performance has dipped, but new training initiatives aren’t having an impact. Later, perhaps you discover that you overlooked a new subgroup of employees with lower-than-expected scores who would respond better to a different style of learning.
It also never hurts to use the direct approach of prompting employees for feedback directly. Taking this step means that you won’t measure understated or exaggerated responses or changes caused by issues outside of your company.
🧠 What’s on your team’s mind?
Leapsome surveys gauge employee sentiment with easily customizable templates and Natural Language Processing to analyze responses.
👉 Learn more
The top benefits of people analytics
After you’ve launched your people analytics strategy, here are some of the positive outcomes you can expect:
- Data-driven decision-making — With data on your side, it’s easier to weigh your options and make the best possible choice. That means quicker, more proactive decisions before issues have time to escalate or opportunities pass your company by.
- Stronger company culture — Data doesn’t have any prejudices, so when you make decisions using people analytics, your company becomes fairer and more consistent. When you communicate the reasons behind your choices, you also foster transparency. Ultimately, this will give rise to more diversity and equitability.
- More effective hiring, onboarding, and retention processes — 82% of HR professionals say they’ve used people analytics to improve recruitment and retention. That’s because this method makes it easier to spot trends in hires and resignations and solve underlying issues before they become more widespread. For instance, if your application process deters candidates, you can fix this before your company gains a less-than-desirable reputation.
- Better performance and development management — You can provide more targeted growth strategies when you have more insight into what your team needs to thrive. Since you can filter by departments, demographics, and tenure, tailoring your support to individuals is simple. For instance, trends in productivity metrics could show you whether or not the introduction of new software is having a positive impact across all your departments.
- Higher employee engagement — Many aspects of the employee experience come back to the connection people feel with their work. If you can use analytics to create holistic performance, development, and engagement initiatives, you’ll notice an impact on motivation. As Gallup tells us, engaged employees are also up to 18% more productive and 43% less likely to resign on average.
Use Leapsome to develop your people
Human resources may never completely close the perception gap between themselves and employees. People’s lived experiences are too complex, changeable, and varied.
However, tools like Leapsome can get you close. People analytics is free from bias and looks broader and deeper than the human eye can in just a matter of seconds.
Leapsome gives you as many perspectives as possible with a range of metrics, visualization tools, and customization options. Our expert recommendations also ensure you’re on the right path when you begin applying your findings so you can create the most impactful strategies.
Our platform goes beyond analyzing the data to collecting the information, implementing the strategies, and tracking their progress. You can use people analytics in everything from meetings to reviews and learning to career development. That way, you leave no corner unturned and ensure you turn an area of improvement into one of strength.
📢 Make analytics and actions speak louder than words
Leapsome not only analyzes your data but allows you to develop impactful performance, development, and engagement strategies.
👉 Book a demo
Sind Sie bereit, Ihre Strategie zur Mitarbeiterförderung zu verbessern?
Informieren Sie sich über unsere Leistungsbeurteilungen, Ziele und OKRs, Engagement-Umfragen, Onboarding und mehr.
.webp)
.webp)
 Fordern Sie noch heute eine Demo an




.png)

.jpg)


